- Low storage inventories, combined with robust winter demand in both Asia and Europe kept spot prices relatively high in the first quarter 2021.
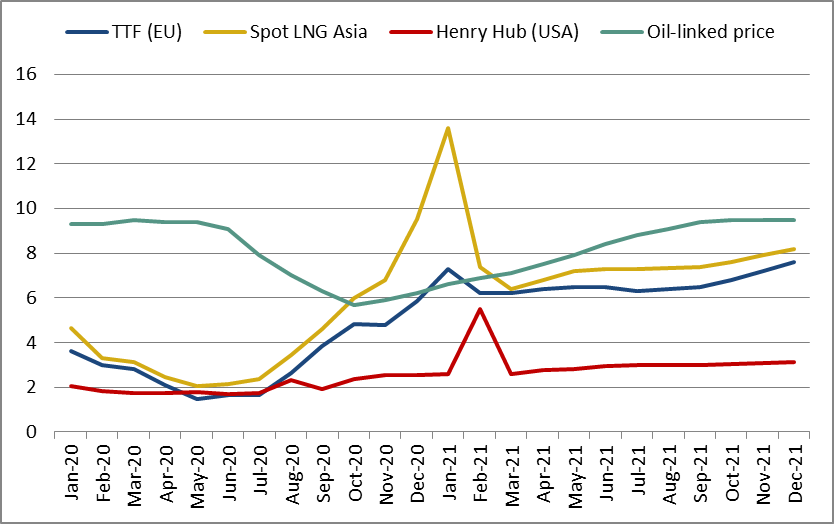
- In the first half of January, Asian and European spot prices spiked to all-time highs as extremely cold weather coincided with tight supply. The Northeast Asian spot price peaked at $30/MBtu by mid-January, opening the widest premiums on record.
- European and Asian spot prices retreated in the second half of January as buying focus shifted to the March and April shoulder months. Moreover, temperatures had warmed and nuclear availability improved in Japan, while supplies were creeping up in Asia.
- In February, the polar vortex propelled US gas prices to historic highs, as extremely cold weather boosted domestic demand and capped production.
- In March, European and Asian spot prices faltered on the year but remained more than double last year’s levels and also 1$/MBtu above 2019 levels. Asian prices held steady on early stock building, supply outages, surging Chinese LNG demand and strong oil and European hub prices.
- In the first quarter 2021, global LNG supply dropped 3% year-on-year as the global market tightened. LNG suppliers targeted Asia, to the detriment of Europe, where the bulk of supply came from Russian gas and storages.
- European storages are now depleted, leaving space for growing European LNG imports this summer. Asian LNG demand is also set to remain strong. These factors support for a positive outlook for prices, although expectations on increased supply availability cap prompt prices gains.
- Oil-linked prices have pursued upward trend since October 2020 to exceed Asian spot prices in March. At the beginning of April, Brent oil prices were still in the high $60/bbl, which will help widen term-spot price spreads and should affect the competitiveness of oil-linked contracted gas exports in the second and third quarter.
Evolution of international spot prices
Asian spot prices skyrocketed in the first half of January amidst cold temperatures in Northeast Asia. On the supply side, outages at regional liquefaction plants and lack of spot LNG revived market tensions.
In Europe, the TTF price started the year on an upswing. It peaked at $9/MBtu on the 12th January, its highest level since December 2019. A European deep freeze, combined with a shortage of LNG, gave a strong boost to prices. Another factor was at play: European LNG imports in January were 50% down from last year’s level as LNG cargoes were driven away to Asia. In February, TTF declined on the month but remained more than twice last year’s level, as a cold spell in the first half, together with low wind speeds had propelled gas demand, up by over 6% yoy. In the meantime, LNG imports were down by 35% year-on-year.
In March, the TTF price held steady, more than twice the level of February 2020, roughly standing at the same level than the Asian spot price for the first time since April 2019. TTF prices were under upward pressure due to production outages in Norway and rising gas demand, especially for the power sector, as the carbon price continued to climb. This latter reached an historical high of €42.8/tCO2 on the 12th March. At some days in the first half of March, the TTF even climbed above JKM for the first time since May 2020.
Gains in European gas hub prices have contributed to robust northeast Asian spot prices. In the second half of March, Asian prices rebounded amidst early stockbuilding and stronger oil and European hub prices.In the US, the Henry Hub jumped 20% yoy in January, in a context of stronger LNG exports and declining gas production. In February, the daily Henry Hub spiked to an historical record of $23/MBtu on the 17th February at the height of the big freeze. At the Waha Hub, gas prices spiked at above $200/mmbtu a few days. Wellhead freeze-offs curbed production, while pipeline freezing constrained the free flow of gas. Meanwhile rotating power cuts affected millions of customers through a couple of days. Accordingly, the Henry Hub averaged $5.4/MBtu through February, its highest level since February 2014. As a result of wellhead freeze-offs, US dry production fell by 7% yoy, whilst gas consumption was up by 4%, leading to massive storage withdrawals.
Figure 1: Evolution of monthly international gas prices ($/MBtu)

Source: Reuters, Argus, Cedigaz
Evolution of oil-indexed contract prices
Since October 2020, the average Japanese LNG price, which is predominantly oil-linked, has gained momentum, in parallel with the increase of the oil prices, taking into account the several month lag in pricing formulas. Most term supply contracts to Japan are linked to the Japan Crude Cocktail (JCC), a monthly average of costs for crudes delivered to the country that tracks spot crude prices with a lag of a few months.
Because of the unexpected price spike in Asia at the beginning of the year, the average Japan LNG price in January, estimated at 8.4$/MBtu, was 40% below the spot level. As the Asian spot price fell 44% in the following month, while the oil-linked price edged up, the Japan average LNG price exceeded spot price in February.
The average price of China’s LNG imports reached a 14-month high of $8.4/MBtu in February, up from $7.4/MBtu in January.
In March, the oil-linked price rose above the spot price, reducing the competitiveness of long term contracts. Considering recent contracts at a 12% slope, the oil-linked term price was estimated at 7.1$/MBtu in March.
Recent developments in the global LNG market
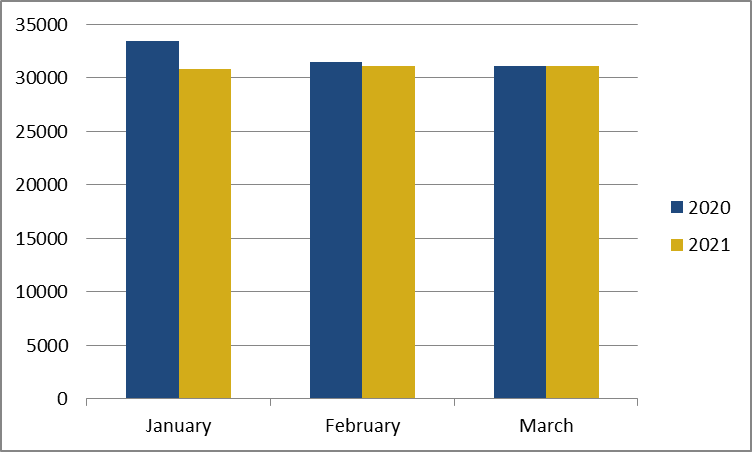
In the first quarter 2021, global LNG supply dropped 3% year-on-year as the global market tightened. LNG suppliers targeted Asia, to the detriment of Europe, where the bulk of supply came from Russian gas and storages.
In January, it is estimated that LNG supply was down 8% year on year. The global LNG supply headed for Asia, where LNG demand, especially for heating needs, surged 7% year-on-year during an extremely cold winter. Reversely, European LNG imports plunged 50%. China and Japan in particular increased their LNG imports by 20% and 7% annually respectively amidst extreme cold winter and low nuclear availability (Japan). On the supply side, there has been an extended outage at Norway’s 4.2mn t/yr Hammerfest facility, which has been off line since September. In addition, production problems at some Australian facilities continued, with the first train at Chevron’s 15.6mn t/yr Gorgon plant off line since early December and the 8.9mn t/yr Wheatstone terminal running below capacity since December.
In February, global LNG trade decreased 1.4% year-on-year. European LNG imports jumped 33% from the previous month but remained well below last year’s level. Northwest Europe’s regasification send out rose to its highest level since May 2020. This monthly growth in LNG inflows served to meet winter demand amidst a cold snap.
In March, global LNG receipts returned to the previous year’s level for the first time since October thanks to stronger deliveries in northeast Asia, the Middle East, Latin America and the Caribbean region. Moreover, there has been a sharp recovery in European LNG imports, up more than 50% from February. European LNG import flows have climbed to approach last year levels, with the JKM-TTF spread tightening and even turning into negative for April deliveries. This recovery has been largely driven by northwest Europe’s liquid hubs.
On the supply side, US LNG exports dropped sharply in February as the wave of polar weather disrupted production but rebounded in March to new record levels. The commissioning of the third 4.5 mtpa train at the Corpus Christi plant helped increase US LNG exports. Qatar, which benefits from flexible and low cost supply, witnessed good adaptability by orienting a larger part of its exports to Europe in March.
Figure 2: Evolution of global LNG supply (000 t)

Source: Cedigaz provisional estimates
2021 Outlook
The markets anticipate sustained relatively high prices compared to last year, as the global LNG supply demand balance is tighter. On the demand side, the outlook is positive as countries boost their Covid-19 vaccination rates and reduce restrictions on industry and activity.
The LNG trade is poised for increasing dynamism in the coming months. Supply upsides come particularly from the rebound in US LNG exports. While global available LNG supply capacity is expected to grow, there is a much greater need to fill gas storages this year, particularly in Europe, following a cold winter. This means growing injection needs for this coming summer. Moreover, maintenances at some Norwegian fields continue and Groningen production is expected to remain low. European LNG imports, which rose in March, are thus likely to remain strong in the near term. These factors could even contribute to competition for summer LNG between Europe and Asia. The European supply picture and related prices’ evolution will strongly depend on the commercial export strategy of Gazprom.
Armelle Lecarpentier, Chief Economist, CEDIGAZ
Contact us: contact@cedigaz.org
Cedigaz (International Center for Natural Gas Information) is an international association with members all over the world, created in 1961 by a group of international gas companies and IFP Energies nouvelles (IFPEN). Dedicated to natural gas information, CEDIGAZ collects and analyses worldwide economic information on natural gas, LNG and unconventional gas in an exhaustive and critical way.
