European LNG net imports: + 27.8% year on year in H1 2015
 LNG net imports increased significantly to 15.9 million tons in the first half of 2015 against 12.4 million tons in H1 2014 due to more deliveries and less reloads. Gross imports showed a two-digit growth rate or even more in all countries but France and Spain – where they decreased by 5% and 15.3% respectively – thanks to the capacity of liquid markets of Northwest Europe to absorb the LNG left available by Asian buyers. Overall, gross imports grew by 11.9%, mostly driven by imports in Belgium, the Netherlands and the United Kingdom. Together, these three countries received 6.88 million tons of LNG in H1 2015 against 5.04 million tons in H1 2014 (+36.7%), mostly from Qatar. The latter, which is diverting flexible LNG from Asia, exported 9.8 million tons of LNG to Europe in H1 2015 against 7.85 million tons in H1 2014 (+24.9%).
Most of the growth occurred in the first quarter of the year, though. In Q1, gross imports grew by 23.6% year on year while in Q2 they only increased by 2.1%. In the United Kingdom, LNG imports even declined in Q2 from 2.82 million tons in 2014 to 2.38 million tons in 2015. Thus, one can expect an overall growth of LNG imports in Europe in 2015, but it may not be as impressive as initially suggested by Q1 data.
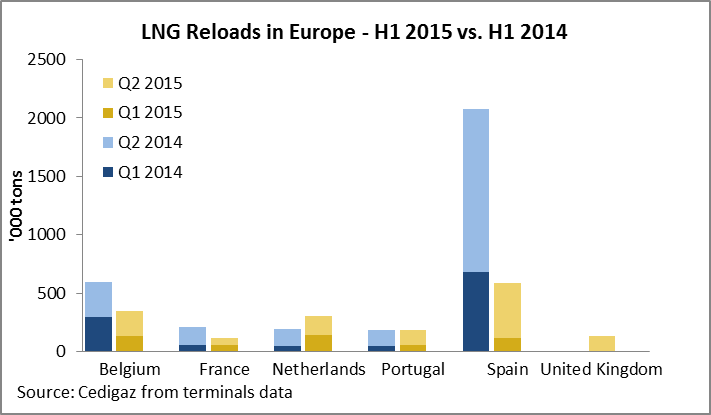
LNG reloads in Europe: -48.8% year on year in H1 2015
 Along with the increase in LNG gross imports, the increase in net imports was caused by the collapse of the reloading business in Europe. Overall, the volume LNG reloaded in European terminals decreased from 3.26 million tons in H1 2014 to 1.67 million tons in H1 2015. In all countries but the Netherlands where re-exports increased (+56.2%) and the United Kingdom which reloaded two cargoes at the Isle of Grain terminal in H1 2015, the number of re-exported cargoes fell. In Spain, which accounted for 65% of European reloads in 2014, the volume of re-exports decreased from 2.08 million tons in H1 2014 to 0.59 million in H1 2015 (-71.7%).
Unlike the growth of LNG imports which significantly slowed down in Q2 2015, the decrease in LNG reloads was steady during the first six months of the year. In Q1 2015, the reloading activity declined by 55.1% and in Q2 2015, it decreased by 45.3% year on year.
The Asian premium down to $0.77/mmbtu in H1 2015
 Such a drop in European reloads can be explained by the convergence of international LNG prices and the decrease of the Asian premium, which commonly refers to the positive price differential between European and Asian prices. While it averaged $7.4/mmbtu in H1 2014, it continuously fell since then and was down to $0.77/mmbtu in H1 2015. Considering that reload costs are between $0.3/mmbtu to $1/mmbtu in Europe and that a shipment from Europe to Asia costs about $0.9/mmbtu at H1 charter and fuel costs, the reloading business appears to be unattractive. Similarly, Latin American prices converged to European prices and the number of reloaded cargoes received by Argentina and Brazil in the first six months of the year fell from 17 to 11 according to shipping data.
Disclaimer: in this post, the analysis is based on terminals and shipping data. Figures may defer from previous analysis based on customs data. Europe refers to EU countries and does not include Turkey.
By Louis Jordan, Junior Economist
