The Brent at $40-48/b in 2016 (vs. $52/b in 2015)
The Brent price averaged $39/b for first-half 2016, i.e. 25% lower than the 2015 average of $52/b. If the price were to remain within the $40-60/b range from now until the end of the year, the 2016 average would fall between $40 and 47/b.
The Brent rose steeply (+58%) between January ($31/b) and June ($48/b). The first quarter was dominated by economic fears, which gave rise to sharp downward corrections on the financial markets between December and February 2016. This led to some very pronounced downward movements on the oil market early in the year. On January 20, for instance, the Brent fell to $26/b, losing $10 in less than one month. The “Brexit effect” has also brought the oil price down: on June 24, the price fell to $46.7/b (-4%) due to Brexit-related financial and monetary consequences (e.g. a rise in the dollar) and economic uncertainties.
Even so, the trend since January has continued to be oriented upward, fueled by the weakness of the dollar until April and also by expectations of seeing a gradual shrinkage of the surplus oil supply. The underlying reasons were the relatively sustained oil demand in 2016 and the steady decline in U.S. production of tight oil since June 2015. Conjunctural factors also weighed on the price, especially production shortfalls in Canada and Nigeria. All of which served to offset the strong rise in supply from Iran, where production may have reached a plateau.
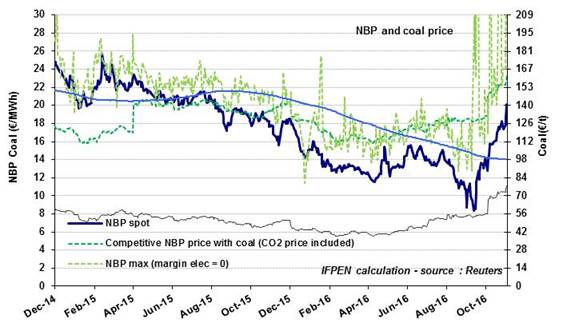
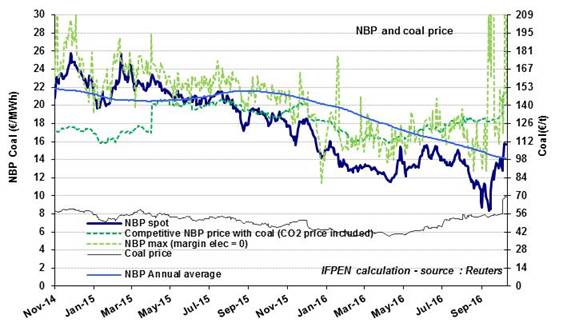
 In October, the NBP price saw a spectacular 44% rise to €16.4/MWh ($5.3/MBtu). This is slightly higher than the price of oil-indexed contracts, a sign that the market is tightening. The NBP continued to climb in early November and now stands at about €20/MWh ($6.5/MBtu). With the slowdown in exports from the United Kingdom to Europe via the Interconnector, this phenomenon now affects all European gas prices.
