The LNG market in June 2020 : Qatar at full speed, US in slow motion.

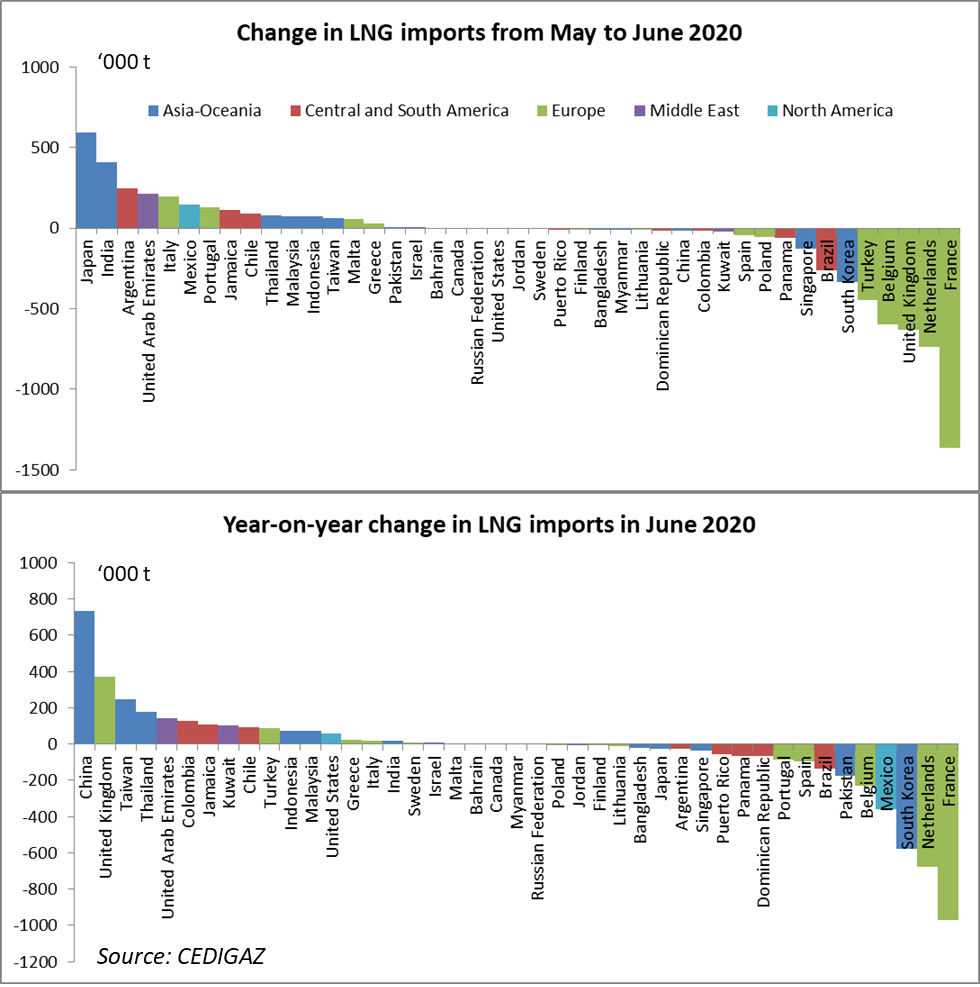
Global LNG import[1] decline accelerated in June. Preliminary data[2] point to an 8% drop (-2.3 Mt) compared to May and a 4.2% decline (-1.2 Mt) year-on-year. Global net imports stood at an estimated 26.3 Mt, which is equivalent to only 72% of global liquefaction capacity, a level significantly below the 5 year capacity utilization range in June for the 2015-2019 period (81-89%). This signals a growing oversupply in the first semester as capacity utilization had remained within the 5 year range until May and shows that the LNG market flexibility needed to absorb the surplus is being stretched to its limits.


The strong decline in June is due to Europe where imports nosedived in several major importing countries : France (- 1.4 Mt), Netherlands (-0.7 Mt), UK (-0.6 Mt), Belgium (-0.6 Mt) and Turkey (-0.5 Mt). Overall European imports (including Turkey) were down 40% in June compared to May (-3.5 Mt). All other regions registered modest growths. In particular imports grew by 0.8 Mt in Asia essentially thanks to Japan (+0.6 Mt) and India (+0.4 Mt) while they declined in South Korea (-0.3 Mt) and remained almost stable in China. The year-on-year picture is less dramatic with imports down by 1.5 Mt (-23%) in Europe, essentially due to France and the Netherlands and up 0.5 Mt in Asia essentially because of China (+0.7 Mt) while South Korean imports declined by 0.5 Mt.
2019: natural gas demand growth slowed but remained strong

In 2019, slower economic growth, Chinese policy changes and a mild winter caused global gas demand growth to slow in a context of oversupply, resulting in a growing LNG surplus and much lower prices. The growth in natural gas demand has slowed down from 5% in 2018 to 2.3% in 2019, returning to the average annual growth rate observed since the start of the century. The main factor behind growth was the switching from coal and oil to natural gas in the power and industry sectors, which was prompted by the competitiveness of natural gas thanks to a growing abundant low-cost supply. This was notably the case in the United States, Europe and some Asian emerging countries. Thus, natural gas has remained the main beneficiary of the energy demand growth, to the detriment of coal in particular, causing its share in the energy mix to expand further.

Quarterly report – Q1 2020 – International natural gas prices

  • The global oil and gas markets are going through an extraordinary period.
  • Crude oil and natural gas prices have fallen significantly since the beginning of 2020 to reach historically low levels at the end of March.
  • Before the spread of the 2019 novel coronavirus disease (COVID-19), spot gas prices were already at seasonal lows due to LNG oversupply, an unseasonably mild winter in the northern hemisphere, economic turmoil (trade war between the United States and China) and renewed confidence in future pipeline gas supply in Europe.
  • China’s gas demand slowed down at the start of the year as the coronavirus outbreak disrupted industrial output. This downturn has gradually compounded the LNG glut on the global spot market and has accentuated the decline in spot gas prices.
  • From mid-March, the decline in spot gas prices has been further accelerated by the impacts of the lockdowns which have ramped up around the world.
  • The impact of the recent slump in oil prices on oil-indexed LNG prices will not be seen until late in the April-June quarter because of the time lag between crude oil and LNG prices under long term contracts.
  • The COVID-19 has already had a devastating impact on global gas demand, which could continue for some time as the pandemic spreads across continents.
  • A number of LNG projects have already faced headwinds amid the coronavirus outbreak and current low oil prices environment. However, as of today, these projects’ delays do not alter Cedigaz’ view for a well-supplied LNG market by 2025/2026.